Schedule Density and Performance Patterns in Football, Tennis, and Horse Racing
David Patterson · Aug 21, 2026
Schedule Density and Performance Patterns in Football, Tennis, and Horse Racing
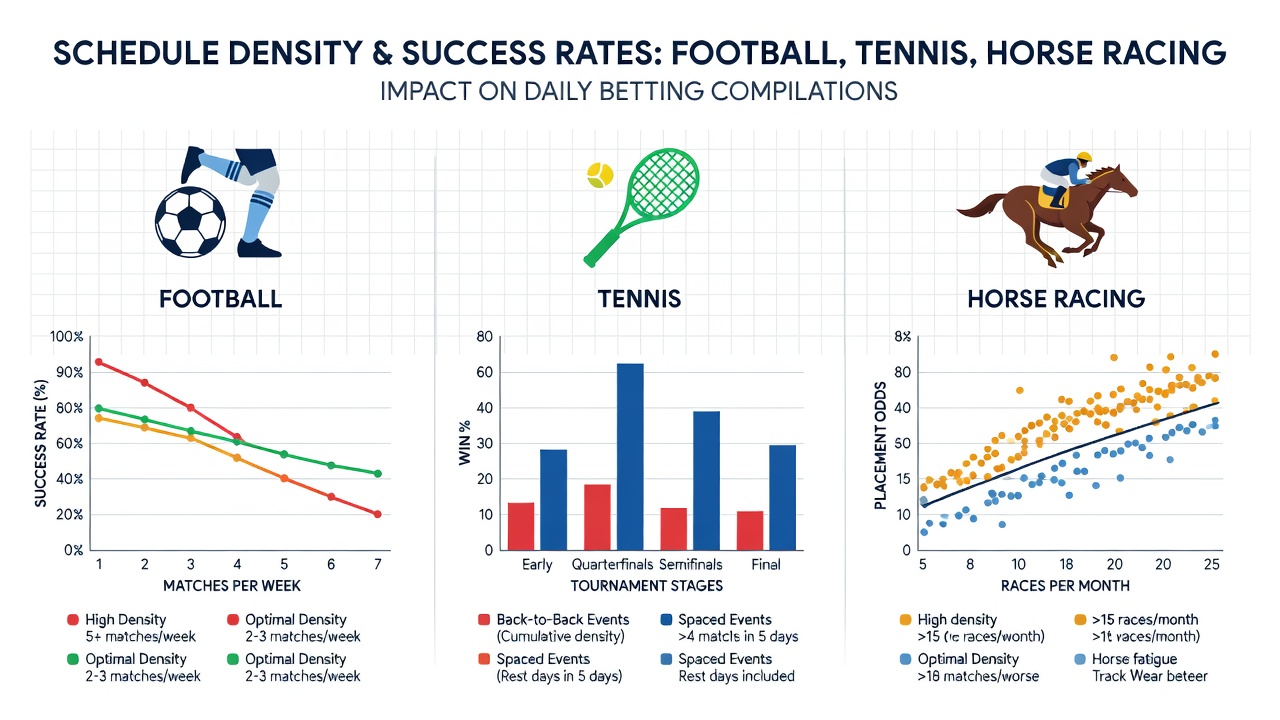
Fixture congestion creates measurable shifts in outcomes across football, tennis, and horse racing, particularly when bettors assemble daily compilations that combine selections from multiple sports. Data from league tracking systems shows that teams or athletes facing compressed timelines often experience drops in key performance metrics such as win percentages and goal tallies, while recovery windows of four days or more correlate with steadier results in subsequent fixtures.
Football Fixture Congestion Patterns
European domestic leagues record the clearest examples during winter months when cup ties overlap with league rounds, and figures from major competitions indicate that clubs playing three matches inside eight days post fewer clean sheets on average than those with standard rest. Midfielders and full-backs log the highest minutes under these conditions, leading to higher substitution rates in the final twenty minutes according to match reports compiled by league statisticians. In August 2026 several Premier League sides will navigate a similar cluster once the new campaign opens, and historical records suggest away sides suffer the largest margin of decline when travel distance exceeds two hundred miles between games.
Tennis Tournament Density Effects
Professional tennis calendars pack multiple events into short blocks, especially on the European swing where clay-court tournaments follow one another in rapid succession. ATP and WTA data sets reveal that players who contest three tournaments inside fourteen days register lower first-serve percentages in the third event compared with those who insert a bye week. Hard-court swing periods produce parallel trends, with qualifiers who advance through multiple rounds showing elevated fatigue markers tracked by wearable devices. Observers note that best-of-five set matches amplify these effects because total court time rises sharply once a player reaches the later stages of consecutive tournaments.
Horse Racing Campaign Loads
Thoroughbred schedules vary by jurisdiction yet still generate density issues when trainers target clustered festival meetings. Australian racing authority records indicate that horses running within ten days of a previous start achieve lower strike rates in Group races than those given fourteen to twenty-one days between outings. In the northern hemisphere, flat-race juveniles often face tighter programs during the summer months, and trainers who space runs across three weeks record higher place percentages according to industry performance databases. Steeplechase horses demonstrate comparable patterns, with fall rates rising when campaigns include back-to-back runs over distances exceeding three miles without adequate recovery.
Cross-Sport Comparisons for Accumulator Construction
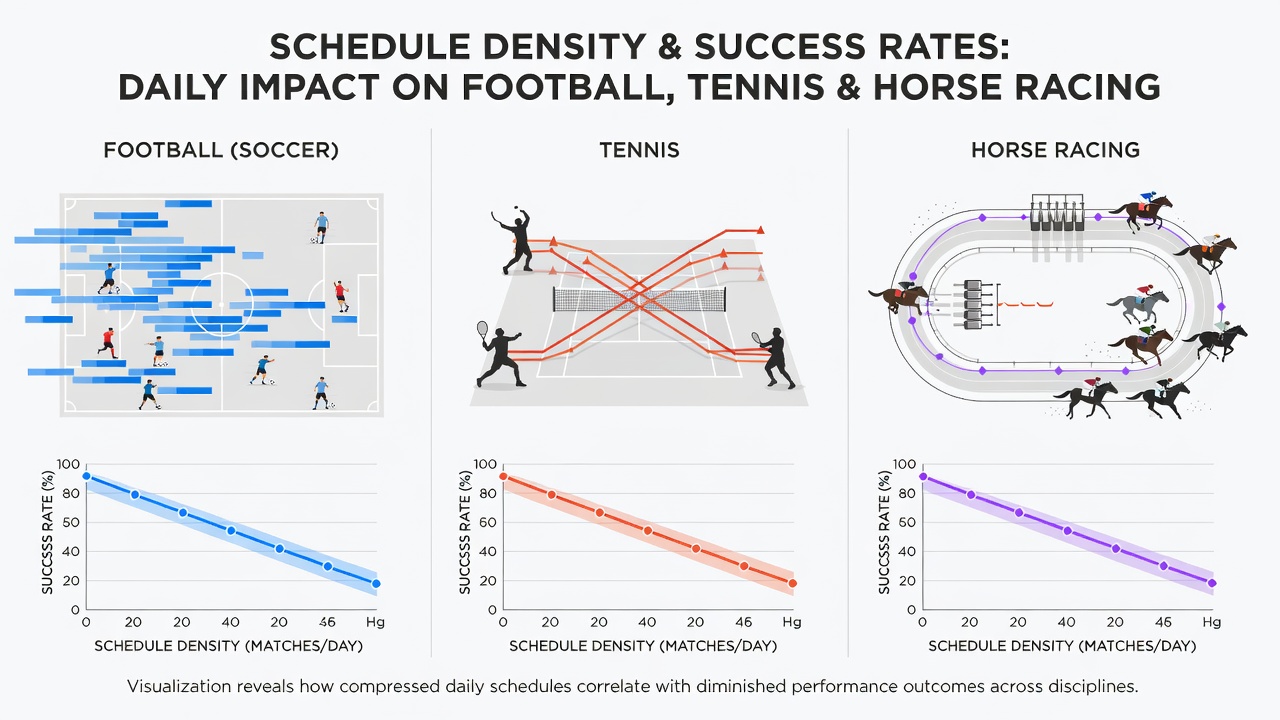
Daily betting compilations that mix football, tennis, and racing selections must account for overlapping congestion windows. Research published by the Australian Sports Commission highlights that multi-sport programs benefit when selections prioritize athletes or teams with documented rest advantages rather than raw form alone. European football data aligns with these observations, showing that midweek cup participants who return to league action on the weekend cover less ground in the opening half compared with rested opponents. Tennis players transitioning from indoor to outdoor surfaces within the same fortnight display similar variability, particularly when the surface change coincides with limited practice time.
Recovery Metrics and Performance Tracking
Modern monitoring tools now supply trainers and coaches with objective markers that feed directly into betting models. GPS units in football boots, heart-rate variability readings in tennis, and blood lactate tests in racing stables all generate datasets that correlate shorter recovery intervals with measurable output declines. A University of Toronto Scarborough study examined three seasons of elite data and found that the probability of underperformance rises steadily once an athlete or horse exceeds a defined load threshold without corresponding rest. These thresholds differ by sport yet follow a consistent directional pattern across samples.
Practical Applications in Daily Compilations
Bettors constructing accumulators gain an edge by cross-referencing fixture lists against published rest intervals before finalizing selections. League tables updated daily in August 2026 will again highlight clubs that played midweek European ties, while tennis draw sheets reveal players who advanced through qualifying rounds into main-draw matches with minimal turnaround. Racing programs list last-start dates beside each runner, allowing direct comparison of campaign density. When these factors align across two or more sports, the combined selections reflect a narrower probability band than raw odds imply.
Conclusion
Schedule density operates as a quantifiable variable that influences results in football, tennis, and horse racing alike. Comprehensive datasets from governing bodies and academic institutions demonstrate consistent relationships between rest intervals and performance indicators, relationships that remain visible when selections span multiple sports within daily betting compilations. Those who integrate recovery metrics alongside traditional form indicators position themselves to navigate the patterns that emerge each season.